Friday, February 23, 2018

The Bethpage Black Experience !


I arrived in NYC 6 years ago and always had the desire to play the course which hosted the US Open 2002 (second US Open victory for Tiger Woods and his eighth "Major") and 2009. The course has also earned the right to host another upcoming Major: The 2019 PGA Championship ! 


This great and huge State Park contains 5 golf courses (!); and reservation system can be an obstacle for some golfers but thought I had to spend some energy to book and play there to fulfill my dream...

But now this is getting scary...


WHAT ARE THE MAIN CHARACTERISTICS OF BETHPAGE BLACK ?

FAIRWAYS are IMMACULATE and THIN;


It is so great to play on these perfectly maintained fairways and feels like playing on a billiard mat :-) 


It's a LONG course;


Just to compare how difficult it is to hit greens in regulation, I've marked (red dots below) all Par 4 above 380 yards from the white tees (a distance that would be difficult to reach consistently for most players) and the results is 10 (of 11 in total) Par 4 are above 380 yards or 90% of them !


It looks (and is) NARROW;


Some fairways are narrow, 6 out of 14 (or 43%) are less than 25 yards (see table below) and especially because the rough is so penalizing, others don't feel extremely large either :-).


If your ball can carry 255 yards (230 meters) on hole 5 as an example, the fairway becomes larger on (same on hole 7). 


(Source of picture: Google Maps)

If not, you need to pull a precise shot and place your ball within a range of 20 yards...

The first cut ROUGH is VERY DENSE;


Attacking the green from this rough is extremely hard, I was impressed by the difficulty to get out of it even with a 9 iron...


You feel stuck in it and you have to hit it pretty hard to get decent distance. 


(Source of picture: http://www.caddybytes.com as I was too focused to get out of this rough rather than taking pictures of it...)


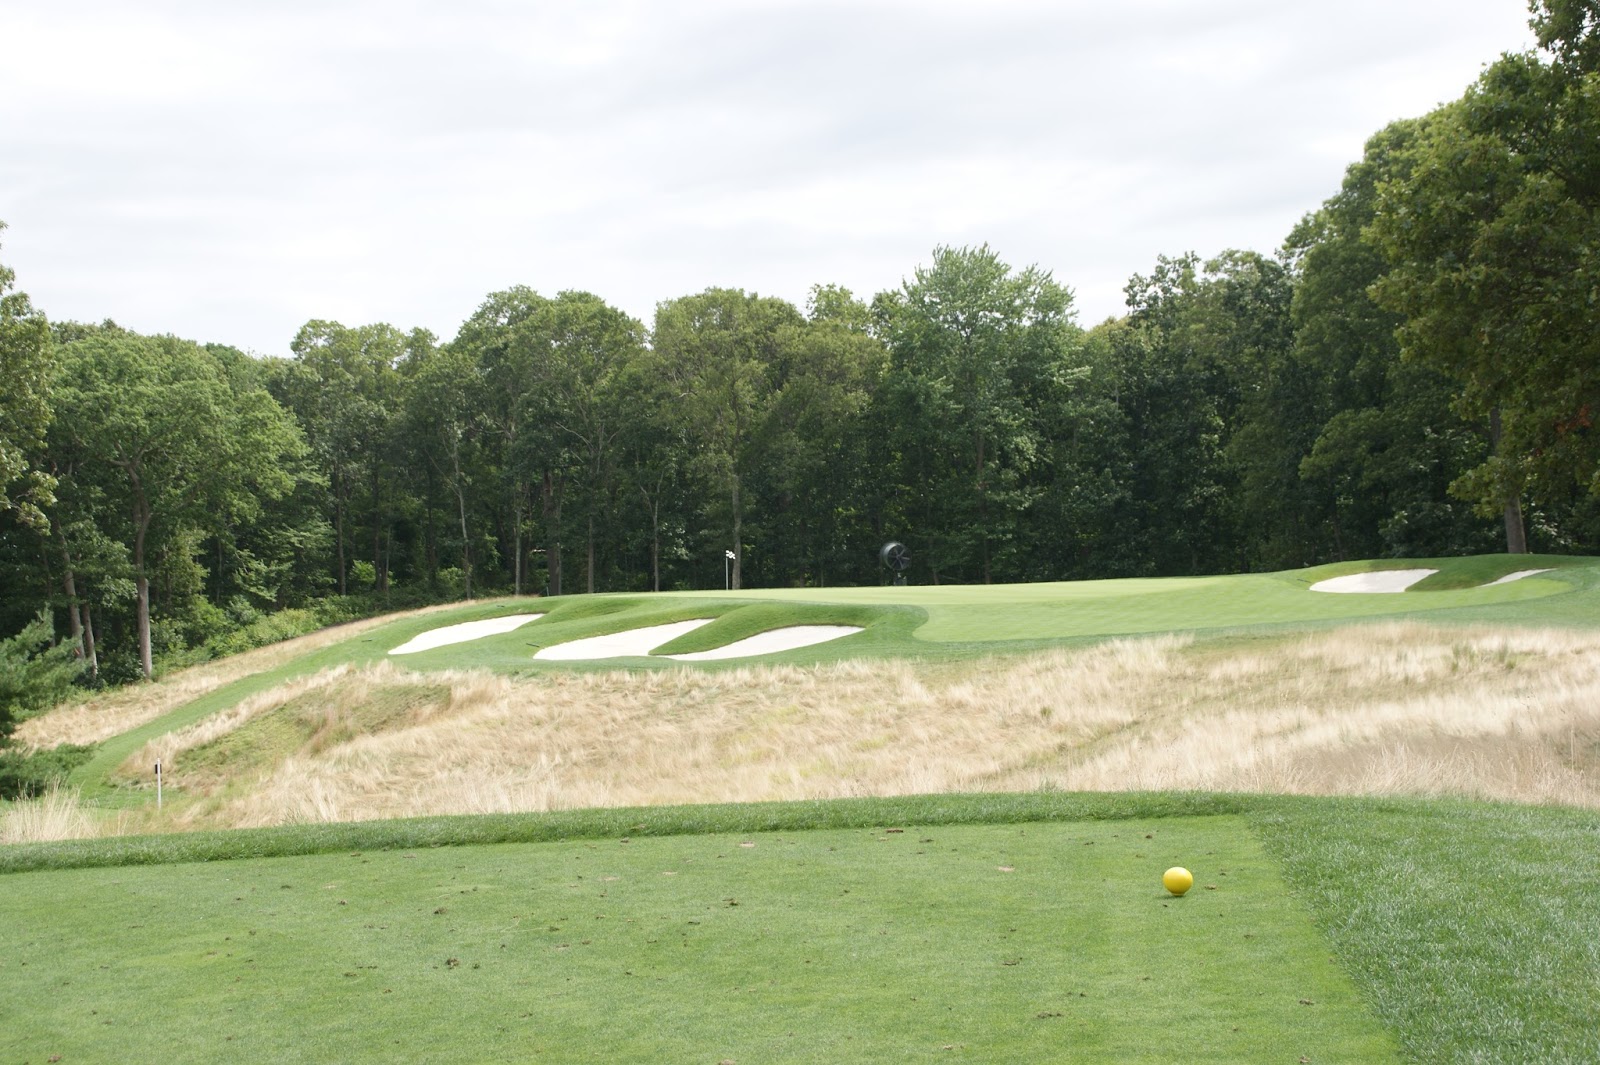
The FESCUE (yellow grass illustrated below) waits for your ball when you are not even in the "regular" rough; and it's extremely hard to get out of it, obviously...; 


BUNKERS are everywhere and deep;


(Source of picture: Google Maps)


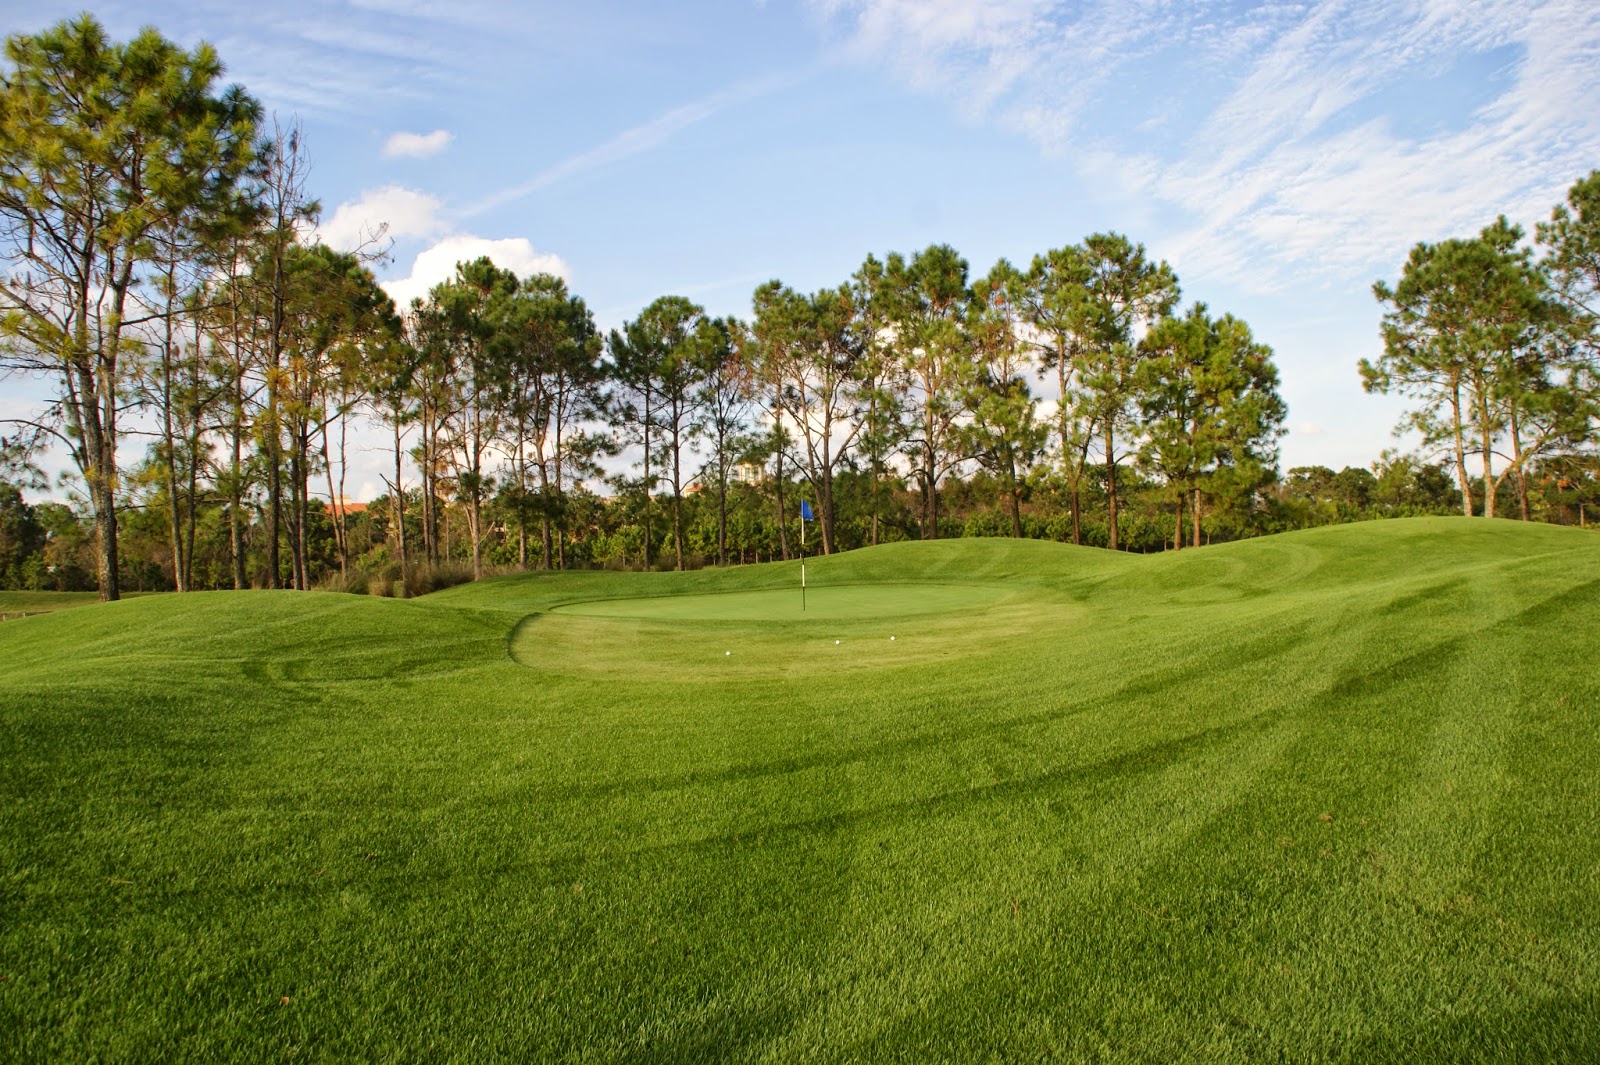
and...SCENERY is beautiful  


The 18th hole is majestic and you can easily imagine how it would feel to play this hole with tons of spectators at the US Open...


It was an amazing golf experience and will go back better armed to hit less shots...ha ha  


Friday, February 9, 2018

DRIVE FOR SHOW, PUTT FOR DOUGH ? 2018 PGA Tour stats by winner to check...


Well, we are going to check with recent Stroke Gained stats published by the PGA Tour on their webiste (www.pga.com).

As of now (beginning of February 2018), 15 tournaments have been played in the 2017/18 period including 8 events where Stroke Gained stats were available by winner. 

This sample is still very relevant at this early period of the season noting noticeable winners such as Dustin Johnson, Jon Rahm, Jason Day, Gary Woodland,...


(Bethpage Black summer 2017... and a birdie on this hole, the one and only of the day :-))))).....) 


I know you are very impatient...so here they are...


We have then compared the importance of the 4 main categories (OFF THE TEE, APPROACH, AROUND THE GREEN and PUTTING) with the Stroke Gained TOTAL and the results are as follows: 


The Strokes Gained OFF THE TEE represents 35% of the total strokes gained for a winner of a PGA Tour event.   
These players rather drive for dough... 

In addition, putting only represents 24 % of the total Strokes Gained, meaning that pros only gain 24% of their total strokes on putting...

And if we sum shots off the tee and long shots (defined here as "approach to the green"), the percentage of importance increases to approximately 70% for the long gameonly 30 % remaining for shots around the green and putting....

This sample of data reflects the most important categories to win a PGA Tour event in descending order : 

First most important: OFF THE TEE
Second most important: APPROACH TO THE GREEN
Third is PUTTING
Fourth is AROUND THE GREEN

To summarize, LONG GAME MAKES THE WINNER and they are BARELY PUTTING FOR DOUGH...

Hope it clarifies... :-)


Tuesday, May 9, 2017

my "single length" golf club journey !

   (Single Length club Sterling Irons tested in Currituck Golf Club, NC)


I did it...I bought a new set for 2017... not a regular set but a "single length" model. Before Cobra and Edel announced the launch of their single or one length set on the market, I bought the Sterling Iron set end 2016 (could not test it before January 2017) having followed this small company for almost a year on the web and social medias.


I chose the equivalent of a 8 iron (36.5 inches) length for clubs from SW to 5i.


The set is divided in two types of club: soft feeling (from SW to 9i) and cavity back (from 8i to 5i).


I've tested them in January 2017 on the range.
It's always difficult to gauge the carry and consistency on a range without a quality launch monitor. On the range, the soft feeling of the lower lofted clubs was great.


The real test happened on the course and here are the results after 5 rounds in 2017:

Green in regulation

a) Green in regulation percentage has improved from 21.6 to 29.6% on average from 2016 to 2017 peaking to 44 and 56% for the last two rounds as I am getting used how to play single length clubs !


This represents a great improvement that allowed me to reach my ultimate goal: single digit handicap ! (my regular handicap was around 14).

An improvement of GIR from 21.6 to 37.6% reflects a potential improvement of 3 strokes for 18 holes, quite substantial then.   


Results from inside 100 meters:

Previous regular length shafts in 2016 (a major golf brand):

90% within 15 meters (17 yards)


Single Length shafts in 2017:

95% within 15 meters, an improvement of 5% !


Results from outside 100 meters:

Previous regular length shafts in 2016 (a major golf brand):

38% within 15 meters


Single Length shafts in 2017:

50% within 15 meters from outside of 100 meters, an improvement of 12% !


Other comments:

Sand Wedge:

I am having absolutely zero difficulty to adjust to a SW with a 8 iron shaft. For whatever reasons I was used to play a few bad fat shots here and there with my previous SW, now I am fully confident and having amazing "gimmy" putts within 3 to 4 feet from 20/25 meters.

Gapping between clubs:

It's very well balanced (10 meters between each clubs based on estimations on the course):

GW (90 m); PW (100 m); 9i (110 m); 8i (120 m); 7i (130 m); 6i (140 m); 5i (150 m).   

Rolls on the green:

I am not feeling at all that the ball is going to roll and pass the green when playing 6 and 5 iron as it stops very quickly. I've measured several times the distance between impact of the ball on the green and the final position and it was minimal (a few meters). 

Conclusion: 


I am very satisfied with the switch (I am not selling anything :-)...) and the stats don't lie as I have always been good within 100 meters but was looking to improve with 7, 6 and 5 iron in hand (even 8 and 9 are much better now !).

I have already improved my inside 100 meters stats by 5% and outside 100 meters stats by 12% and expect to further improve outside 100 meters as I am getting used to this new single length set. 


Wednesday, February 11, 2015

"Profiling your golf game": time to shoot lower score !

This article is going to help improving your golf game forever !

2014 is over and it is now time to think about the objectives of the new 2015 golf season ! 

Cosily seated inside and based on the strokes gained calculation I decided to summarized my 2014 year by determining the lost strokes by distance and will try to explain how to "profile" your golf game and shoot better score in 2015 !

(the beautiful view on the Golden Gate in San Francisco!)

Here is the process:

a) Calculate your average strokes gained/lost by distance for 3 to 5 significant rounds of golf (read the previous post on this blog for the calculation method).

On the table below, column 9 represents the "Drive and Lay-up/second" shots and column 13 represents "Attack of green" noting that it also needed to calculate the average strokes gained (/lost) for putting. However the average strokes gained on putting was zero in my case explaining the absence of data for putting in the related table. 

b) Determine your average number of shots by distance based on the same 3 to 5 significant rounds.
(column 14 below).

c) Based on the related columns (9 and 13) you can now calculate your strokes lost compared to a scratch who obviously has an average stroke gained of zero per shot.


Examples:

Example of strokes lost on yardage of  "> 500 yards"

The 2014 average in the table below was -0.20 (column 7) multiplied by 3 shots (column 6) = -0.60 stroke lost.

The scratch player would only have lost 3 shots x -0.01 = -0.03 stroke lost.

Difference between the player and the scratch golfer = 0.60 - 0.03 = 0.57 stroke lost (rounded here to 0.6 in column 15). See "Ex 1" in the table below.

This is explained by the fact that the distance of my shot averaged 215 yards compared to the scratch average of 265 yards (on this yardage) noting that the total distance requested (ideally 265 yards to play scratch) decreases as the yardage of the hole decreases. See for example that the ideal distance on a tee of 300-324 yards is 235 yards...

Example of "lay-up" from 175-199 yards

The lost strokes on this yardage were pretty significant including a deficit of 2.1 strokes.
In order to play like a scratch golfer I should have attacked the green trying to catch the green reaching a 37 feet distance from the pin threshold to get an average stroked gained average of zero, the scratch player average... 

Lay-up does not pay, then...? It depends on where you lay-up though as the further the lay-up, the better !

Example of "attack of green" from 125-145 yards

Lost strokes were 1.5 on an average of 3 shots for this yardage.
To get a scratch player average, I should have targeted the 31 feet from the pin threshold or an error margin (distance from the pin divided by total distance: 31 feet/125 yard=8%) of 8% compared to my 2014 margin error of 14%. 

Where to focus the practice ?

On the areas where the most lost strokes are concentrated: 

- From 125 to 199 yards as 6.4 strokes were lost representing 40% of the 14 strokes (=handicap) lost 

- And then evenly on the driving and attacks of the green (that could be break by yardage too to get a precise picture) as there areas respectively represents 2.8 and 2.9 lost strokes or another 40% of the 14 strokes lost !

Conclusion: 

By knowing your game profile, the number of shots you lose per yardage, you will be able to work on your weaknesses and shoot lower score !


And this is the first time the golfers can mathematically quantify this. Exciting, right ?


(practice session in the beautiful "Celebration Golf Course" in Orlando, FL. December 2014)


Tuesday, April 1, 2014

Golf stats revolution : the gained strokes concept !

I’ve just finished a fascinating golf book on golf statistics called “Every Shot Counts: Using analytics to improve your golf performance”.


Don't stop here and continue reading as these kind of statistics are not boring at all !
This book might be a revolution helping golf players to really estimate their golf skills and improve their performance!
I will share with you the calculations I made hole by hole compared to a PGA Pro and therefore try to understand which part of the game we could improve! 
The concept of "stroked gained" in golf has been introduced by Mark Broadie, professor at the Columbia Business School of New-York, who first calculated the average putting strokes gained  by a player compared to the average field of players in a PGA tournament, this indicator helping to illustrate whether a golfer was beating the field at putting or not... 
Example of putting strokes gained: a stroke gained indicator of +1.2 would simply mean that the player putted 1.2 strokes less than the average field of players on 18 holes while an indicator of -2.0 would mean that the player putted 2 strokes more than the average PGA Tour field on 18 holes. This indicator therefore reflects the putting performance of one player compared to the field.   


The stroke gained was recently adopted as a new stat by the PGA Tour which represents a big achievement for his creator and praobably a big step forward in term of golf stats for the whole golfing community!
Measuring the putting performance is important but however not sufficient to explain the global performance of a golfer. This explains why the author also developed the concept of strokes gained for shots outside the green: gained strokes for driving as well as gained strokes for the short and long game. 
Based on a simple table to fill on every hole played, I recently managed to implement the calculation of the exact gained/lost strokes for every shot.
Table to fill on each hole:


Results reported after the golf round on an xls sheet including Pro average and the calculations


Column1: represents the position of the ball from the pin/flag measured in yards (measured with a laser range finder or marks indicated on the fairways) and feet for putts on the green.

Column2: club played.

The position of the ball indicated in column3 (tee, fairway, rough, sand, recovery shot or green) will have an influence on the average strokes of the PGA player (column4 of the table), the average of shots to putt the ball in the hole being be more important as the ball stands in the rough, in the sand or for a recovery shot (from the woods for example) than on the fairway.

The average strokes PGA reflected in column4 represents the data collected by the author of the book and will help to calculate the strokes a player would gain/lose against the pro.

The strokes gained (positive number) indicator or lost (negative number) compares the one stroke I need to move the ball forward to the average strokes needed by a PGA player to move the ball from the same position.

On the first hole, a drive from 498 yards would result in an average score of 4.41 strokes for a PGA professional while the next position from 260 yards would result in a score of 3.58. The difference of 0.83 strokes between these two numbers (see column6, 4.41-3.58=0.83) is then compared to the 1 stroke I need to move the ball to the same position.

I therefore only lost 0.17 strokes (0.83-1=-0.17) for that good drive on the fairway compared to a golf pro  (column8).

The lost stroke of -0.17 is however minor  and is a good result compared to the missed shot only moving the ball from 165 to 106 yards as the latter would result in 1 full stroke lost (-1.01, hole 1, column8 )! 

These two examples solidly illustrate that a good/bad shot can now be mathematically measured !

Here below the conclusion of the entire round:


Based on the table above, the putting only represents 18% of the total lost strokes while the long game (drive + shots >165 yards) represents almost half of all lost strokes (47%). Working on the long game seems to be worth it as 10.2 stroked separates me from the pro on that part of the game ;-).

This table also indicates an excellent putting on the back nine as only 0.5 shot was lost compared to a pro which is a level pro putting !